Derived Thermo
Introduction
I found out that there are derived thermo quantities from the NCDC IGRA data. So I must plot them on top of the RGBs.
Dataset
I used the derived data (located here).
The important variables are…
- Inversion height (if inversion) AGL
- Mixed layer height AGL
- Freezing height AGL
- Lifted Condensation Level (LCL) height AGL
- Level of Free Convection (LFC) height AGL
- Level of Neutral Buoyancy (LNB) height AGL
Samples
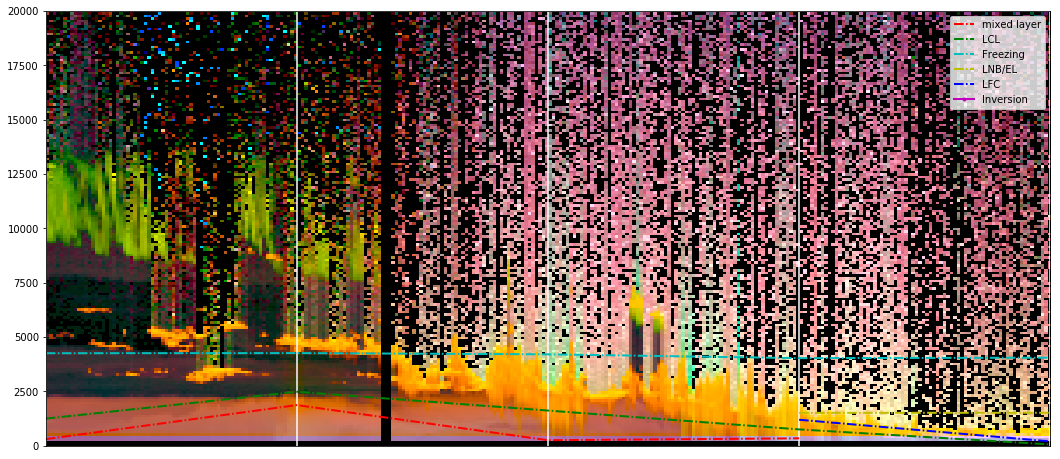
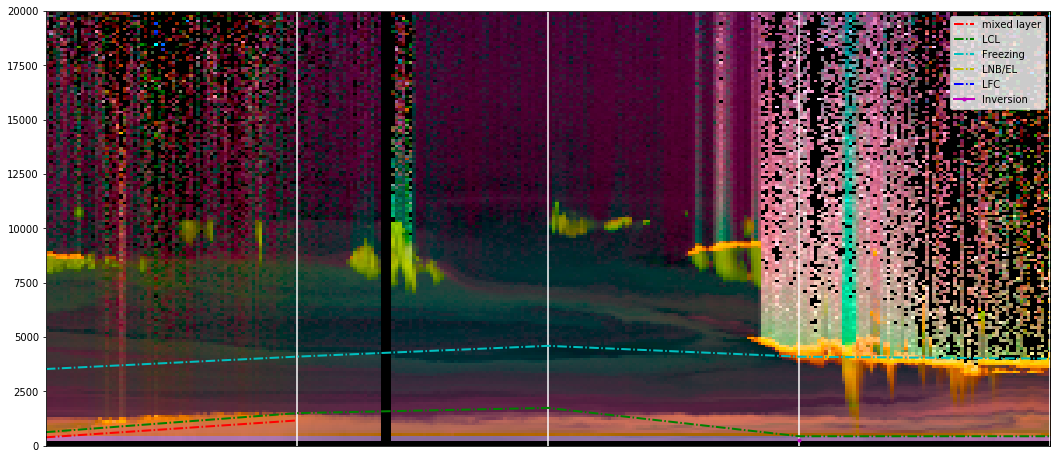
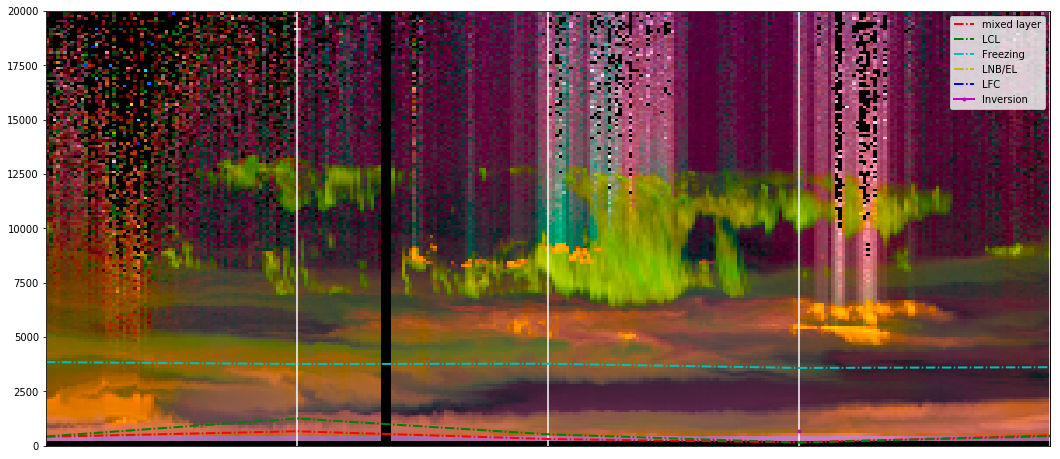
Here I have plotted these levels over the RGB. White lines mark the sonde times.
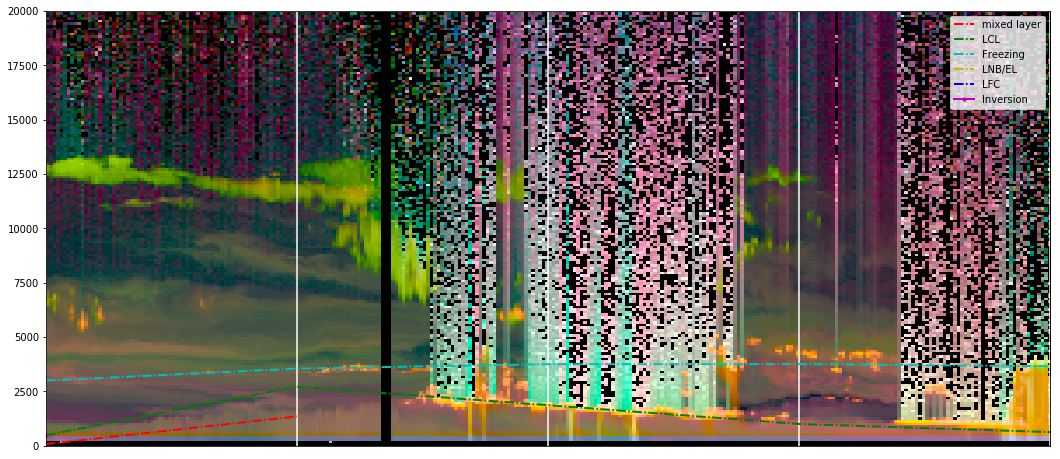
In this image there appears to be two distinct layers of water cloud. One is sitting on the LCL, the other is sitting on the freezing level. If you look off to the far right on the freezing line you see that there is a precipitating ice (green) cloud.
In fact, I’ve seen what appear to be water clouds right on the freezing level quite a bit. However, I’ve only really looked in the summer.
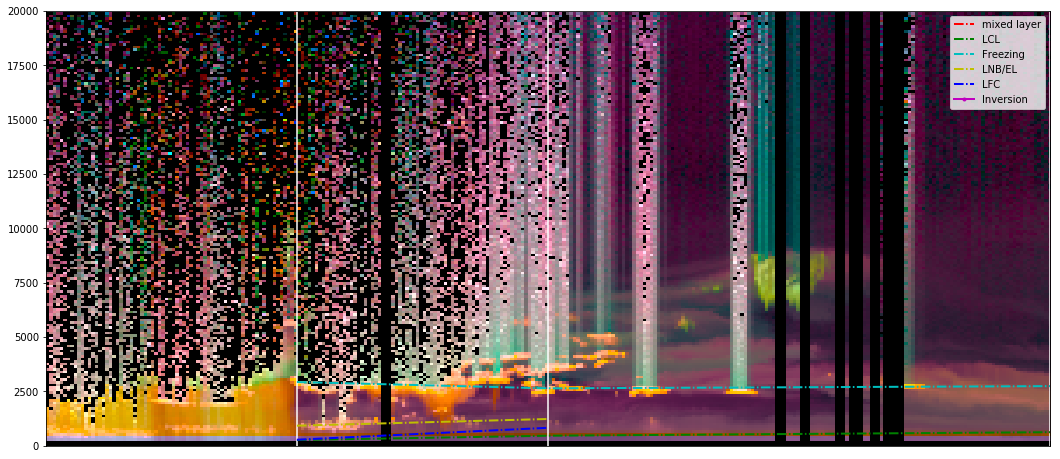
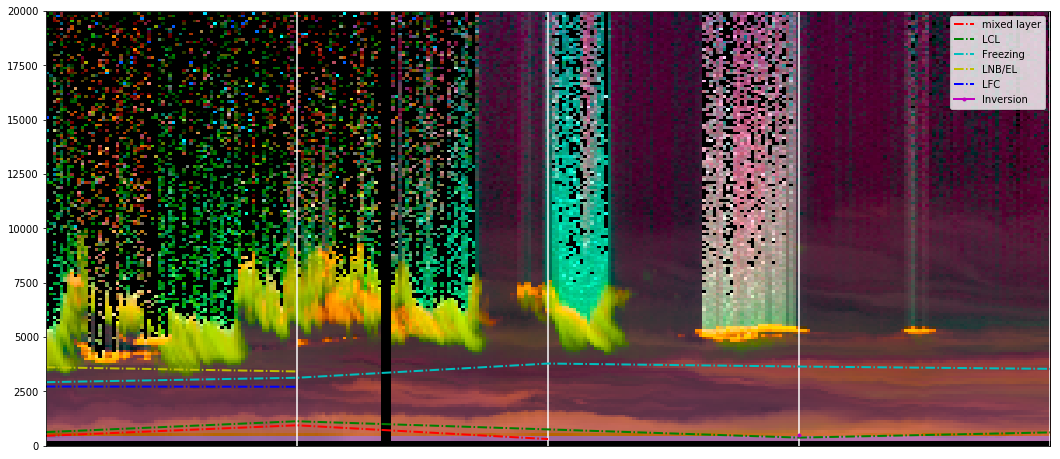
There are also plenty of times water-lookin’ clouds are well above the freezing level.
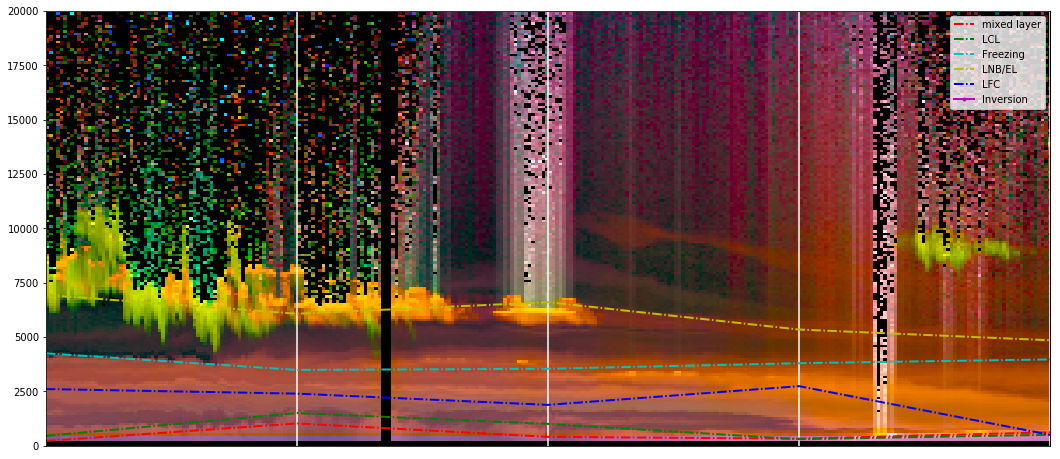
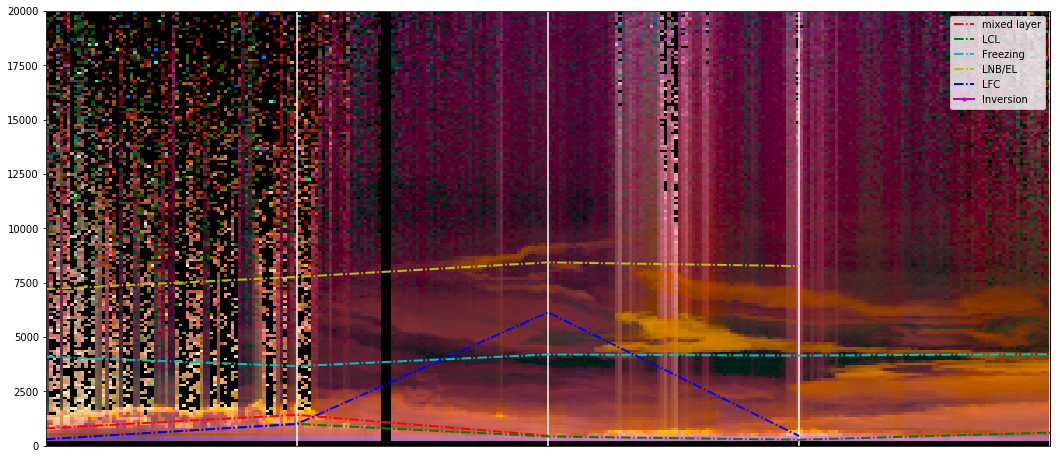
Also some just look interesting…
Summary
I found the freezing level and I sometimes find watery clouds clustered at it.