Diseased RGB
Introduction
RGBs have been used for displaying multiple channels of satellite data simultaneously. There are those that dislike RGB because calibration and scale differences make them difficult to interpret. Nevertheless, I am not good at looking at multiple plots simultaneously so I have attempted to make an HSRL RGB.
Choosing a color mapping

That is the legend, showing how I mapped the color space. My idea is that backscatter cross section is an extrinsic property of an aerosol specimen. You can increase it by simply increasing concentration, so luminosity will exclusively display backscatter. In a 3D color space that leaves two more dimensions, but there are more than two remaining channels that could be displayed. Some candidates are extinction cross section, lidar ratio, depolarization, 1064 backscatter, color ratio, maybe even wfov. Color should reflect intrinsic properties of the target, so either lidar ratio, depolarization, or color ratio. Lidar ratio is noisy, and I’m not certain on the calibration of the extinction; so I’m choosing depol and color ratio. Color ratio is 1064 / 532, depol ranges from 0 to 0.6 and is logarithmic.
The CIELAB colorspace will let me set a uniform apparent brightness from the backscatter cross section and vary the color using the a and b parameters. There are other beneficial properties like each color maps uniquely to one set of properties, colors seem uniform in different brightnesses, and converting to greyscale completely recovers the backscatter image. That is how I got the legend.
How does it look? I call it the “diseased” color map
Interpretation
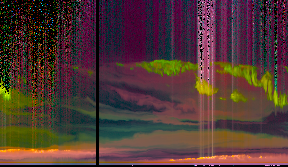
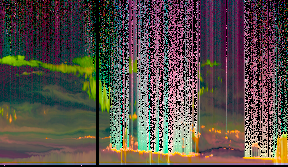
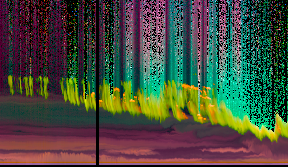
But now I can see so much more than before. In this colormap the ice vs water distinction is very clear. Ice has high depol and low color ratio so it shows up as a fluorescent green. Water also has a low color ratio, but a low depol as well, so it looks bright orange.
The simple interpretation is:
- Orange => Large spherical (water droplets)
- Green => Large nonspherical (ice, pure dust)
- Pink => Small spherical (deliquesced aerosols)
- Blue/Green => Small non-spherical (aerosols)
Summary
Using this colormap you can get an idea about the scattering concentration, particle size, and particle shape. I am really interested to look through these rgbs and discover the typical properties.
If you are in-network you can browse all images here