RGB and Sondes
After seeing lots of what appears to be virga in these cases, I’d like to know a little more about the thermodynamic environment. In particular I’d really like RH data, especially since is will also be useful to diagnose deliquescence and analyze hygroscopic aerosols. I considered using reanalysis data, but the spatial resolution will be too low.
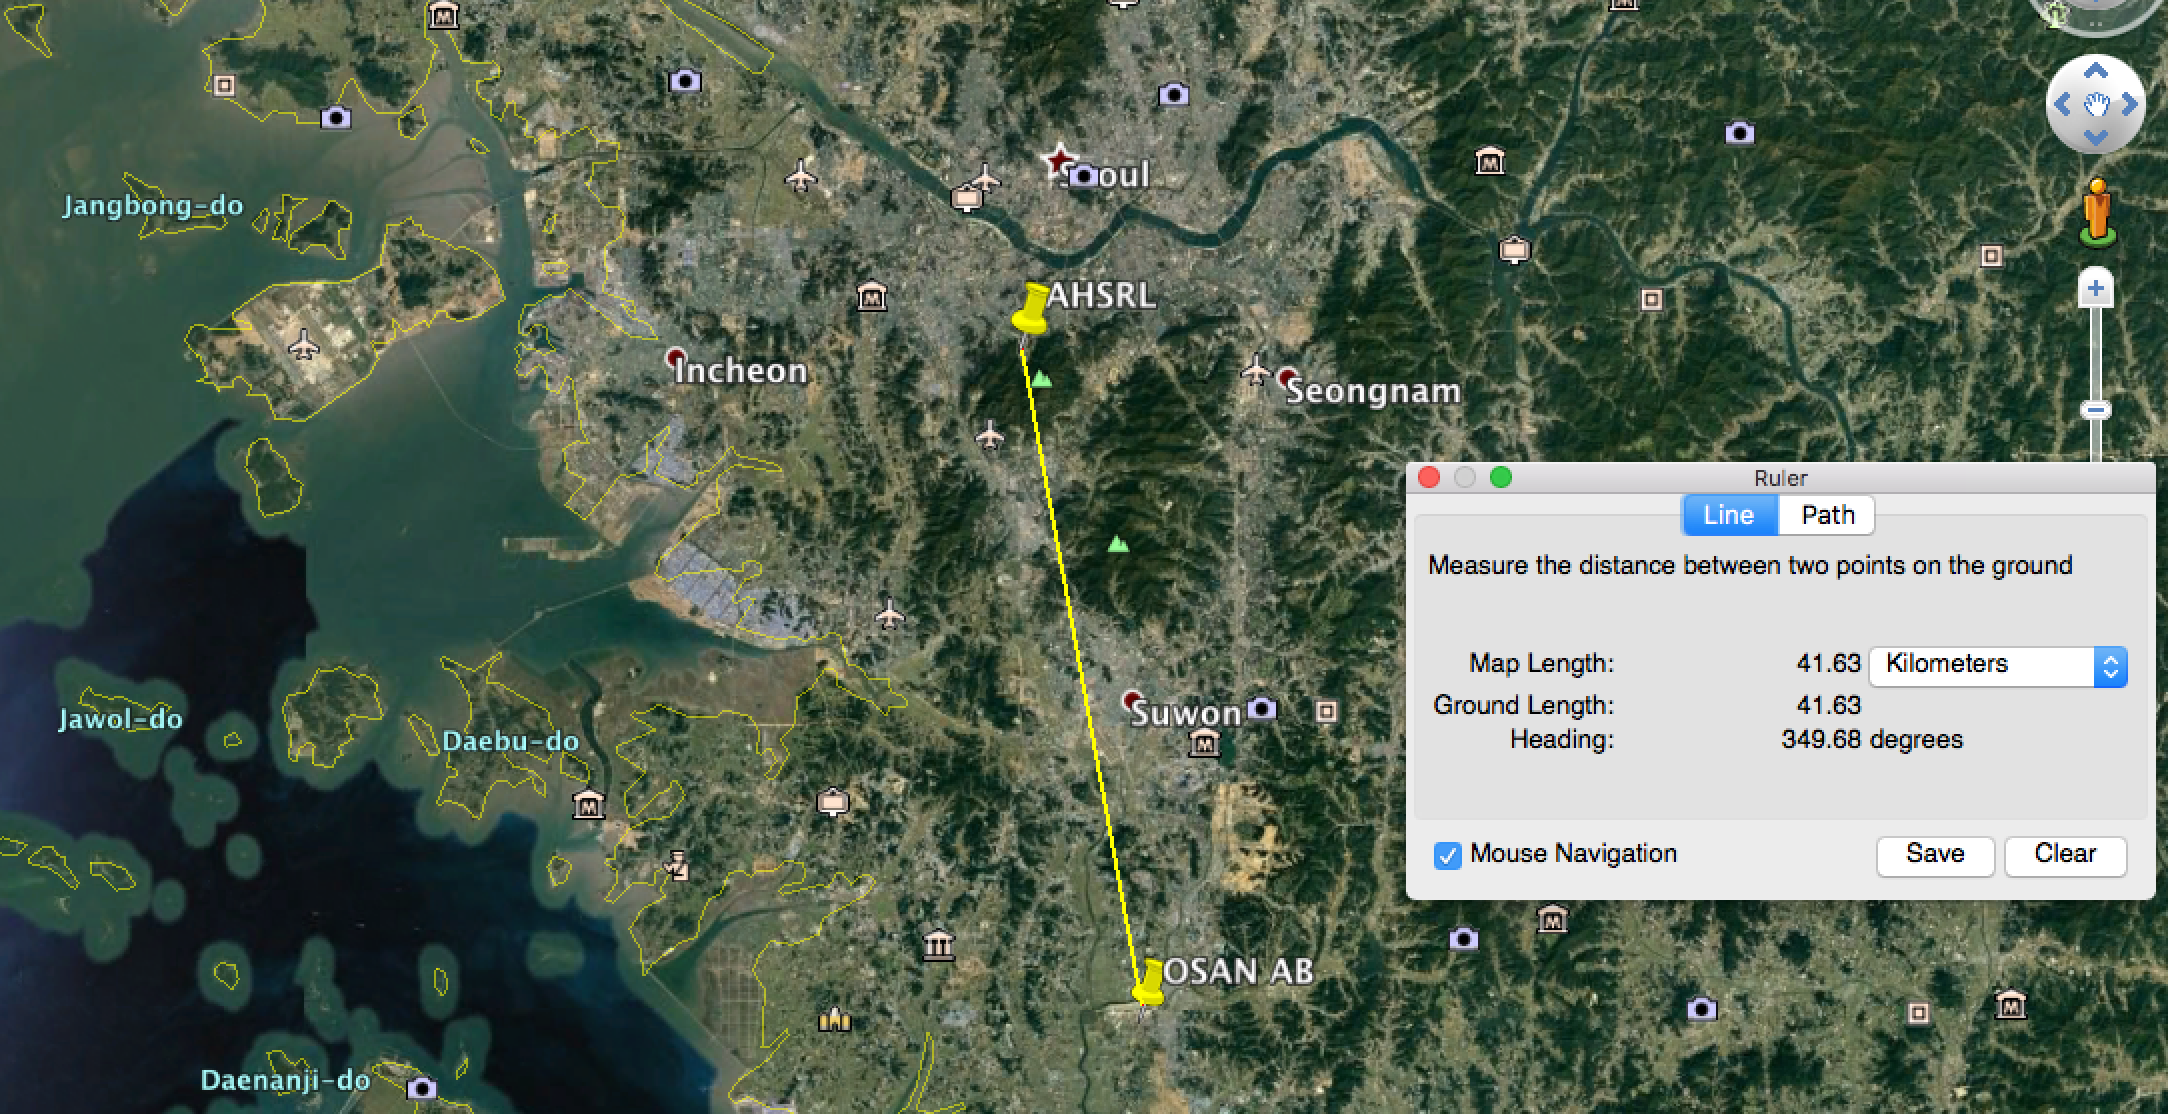
Luckily, there is an airport only 42 km away that does 4 radiosondes per day. That might not be enough data, so I’ll try to get AMDAR data, but let’s see what it looks like anyway.

The data I found https://www1.ncdc.noaa.gov/pub/data/igra/data/data-y2d/KSM00047122-data-beg2016.txt.zip looks like this in the database:
| station_id | time | pressure | gph | rh | dpdp | wdir | wspd |
|---|---|---|---|---|---|---|---|
| KSM00047122 | 2017-02-22 00:07:39 | 73 | 280 | 24.7 | |||
| KSM00047122 | 2017-02-22 00:07:39 | 70 | 18440 | 28 | 290 | 24.7 | |
| KSM00047122 | 2017-02-22 00:07:39 | 70 | 295 | 24.7 | |||
| KSM00047122 | 2017-02-22 00:07:39 | 62 | 300 | 14.9 | |||
| KSM00047122 | 2017-02-22 00:07:39 | 62 | 28 | ||||
| KSM00047122 | 2017-02-22 00:07:39 | 60 | 285 | 14.4 | |||
| KSM00047122 | 2017-02-22 00:07:39 | 58 | 28 | ||||
| KSM00047122 | 2017-02-22 00:07:39 | 55 | 320 | 14.9 | |||
| KSM00047122 | 2017-02-22 00:07:39 | 54 | 310 | 12.3 | |||
| KSM00047122 | 2017-02-22 00:07:39 | 53 | 275 | 10.3 | |||
| KSM00047122 | 2017-02-22 00:07:39 | 52 | 295 | 12.3 | |||
| KSM00047122 | 2017-02-22 00:07:39 | 50 | 20490 | 27 | 295 | 16.5 | |
| KSM00047122 | 2017-02-22 00:07:39 | 50 | 27 | ||||
| KSM00047122 | 2017-02-22 00:07:39 | 49 | 300 | 20.1 | |||
| KSM00047122 | 2017-02-22 00:07:39 | 47 | 28 | ||||
| KSM00047122 | 2017-02-22 00:07:39 | 46 | 305 | 12.3 | |||
| KSM00047122 | 2017-02-22 00:07:39 | 45 | 285 | 14.9 | |||
| KSM00047122 | 2017-02-22 00:07:39 | 43 | 295 | 12.3 | |||
| KSM00047122 | 2017-02-22 00:07:39 | 42 | 265 | 11.3 |
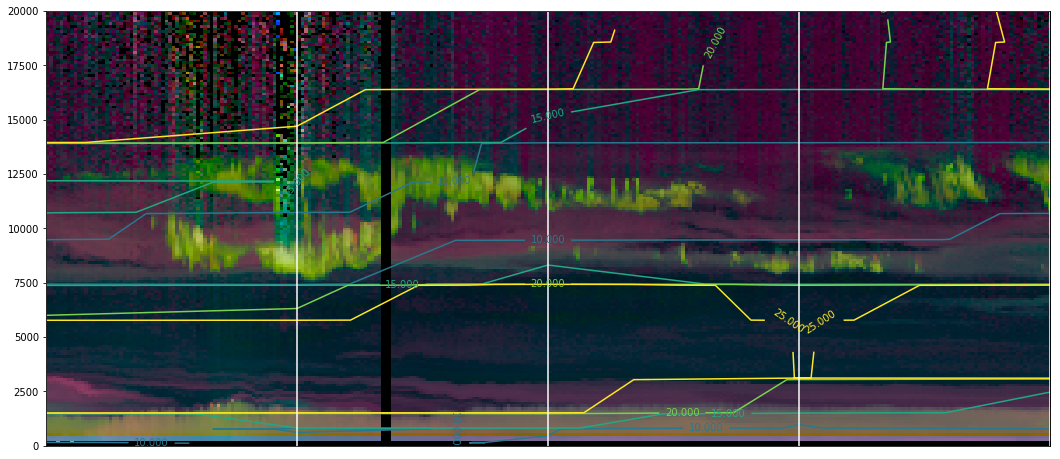
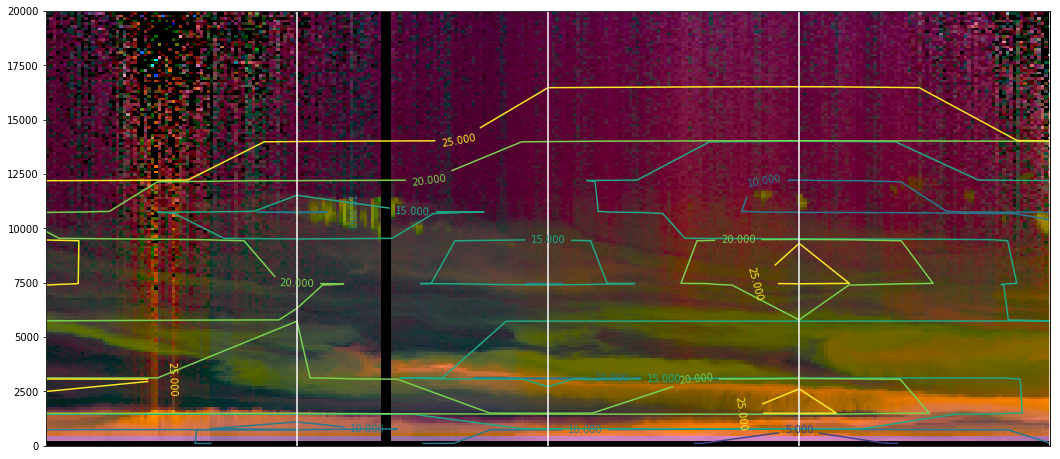
Now, I have HSRL data in altitude coordinates so I just used geopotential height as the vertical coordinate. The rh is always missing, so I used dew point depression (degC) instead. As you can see there is lots of missing data, so I need to interpolate vertically. I also can only have 5 points per day. Anyway it looks like this…

There is a big blob of dry air below the clouds, and there is an aerosol layer in what looks like a moisture gradient. The clouds are of course moist, which is reassuring.

In the very center you can see that the aerosol get more orange in the region of enhanced humidity. Evidence of deliquescence?
If you are in-network you can browse images here