Analysis of 2016-05-04
Introduction
Here I will do my best to scrutinize and elaborate on what we see on May 4th.
First impressions
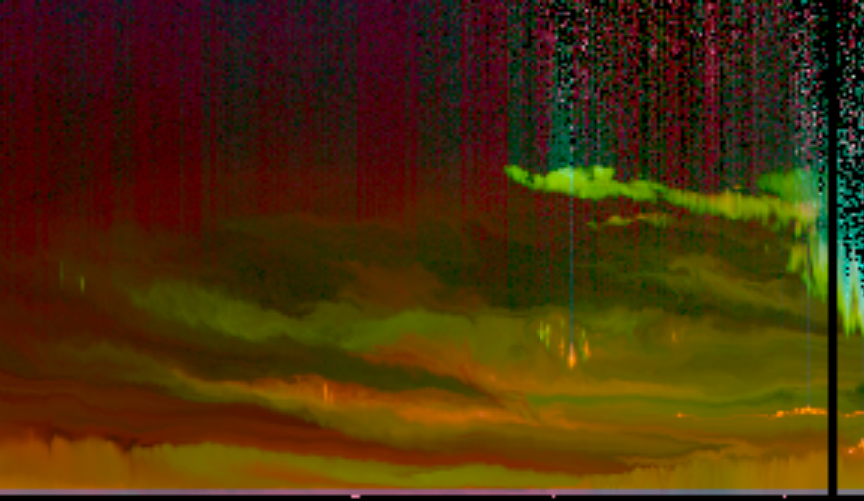
- Multiple layers from different places
- Top layers originate in the west, but the surface layer came from the north
- Dust
- Polluted dust
- Clouds
- Supercooled water clouds forming next to ice clouds inside dust layer
- Cirrus
- Clouds at LCL
- Smoke
- At surface
- Between PBL and dust layer
Where did it come from?
The junction at 3km and 23:30
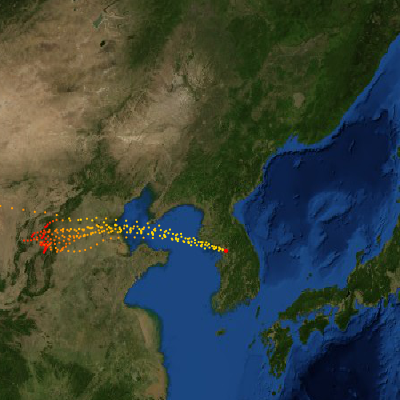
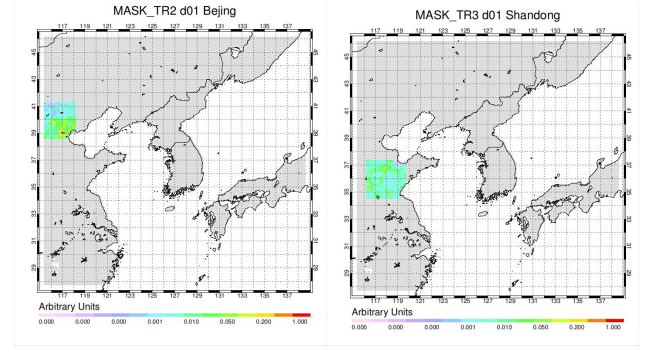
Flexpart tracers show the parcel at 3km and 23:30 coming from around Shijiazhuang. For the most part, this represents the path taken by the non-dust part of the fork. Unfortunately, this area is between the Bejing and Shandong source domains in the WRF tracer simulations, though their influence can be seen anyway.
How it got up there
You can see the convection that lofted the pollution firing at about 0900.
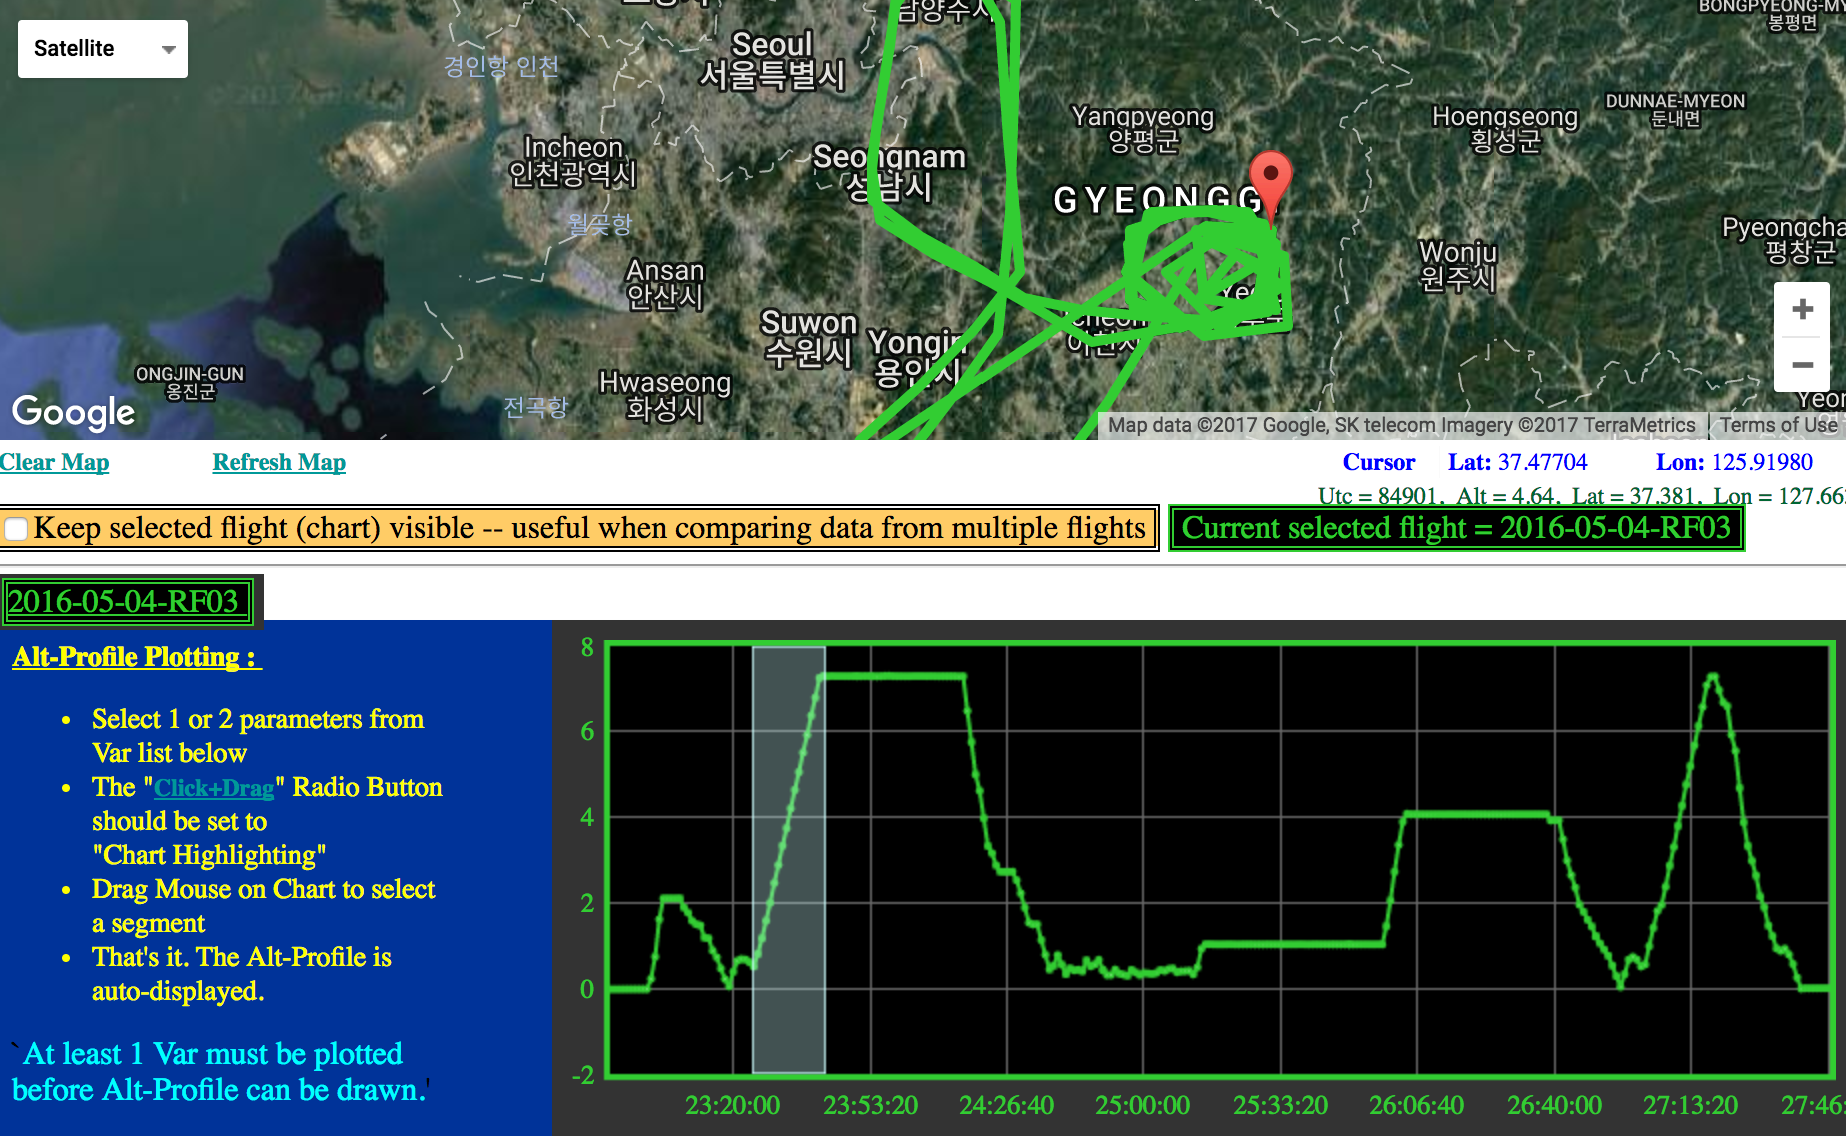
Pulling in more data
The DC8 performed a spiral upwards over Taechwa, 36 km away from the HSRL, starting at 23:24 and 600m and ending at 23:41 and 7.3 km.
This gives us an opportunity to incorporate in-situ observations into our analysis.
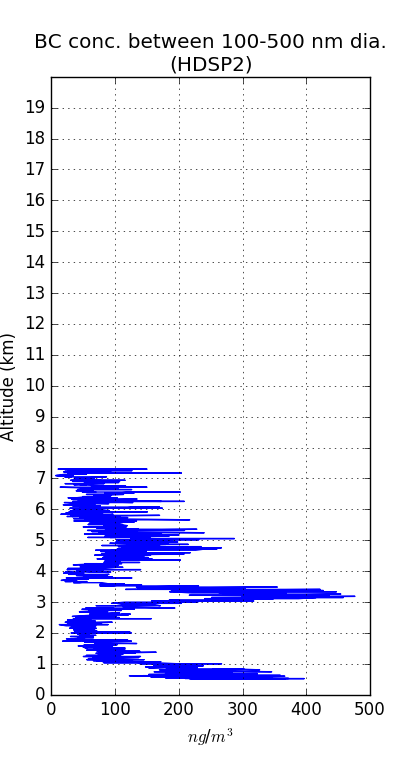
Black carbon concentrations
We see that black carbon concentrations are greatly elevated at just above 3km.
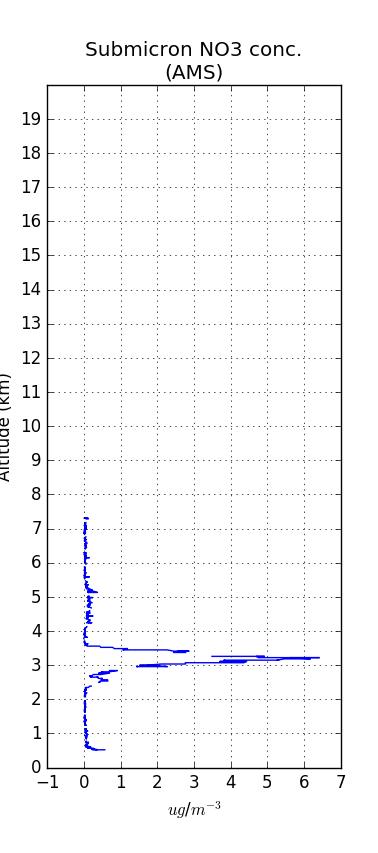
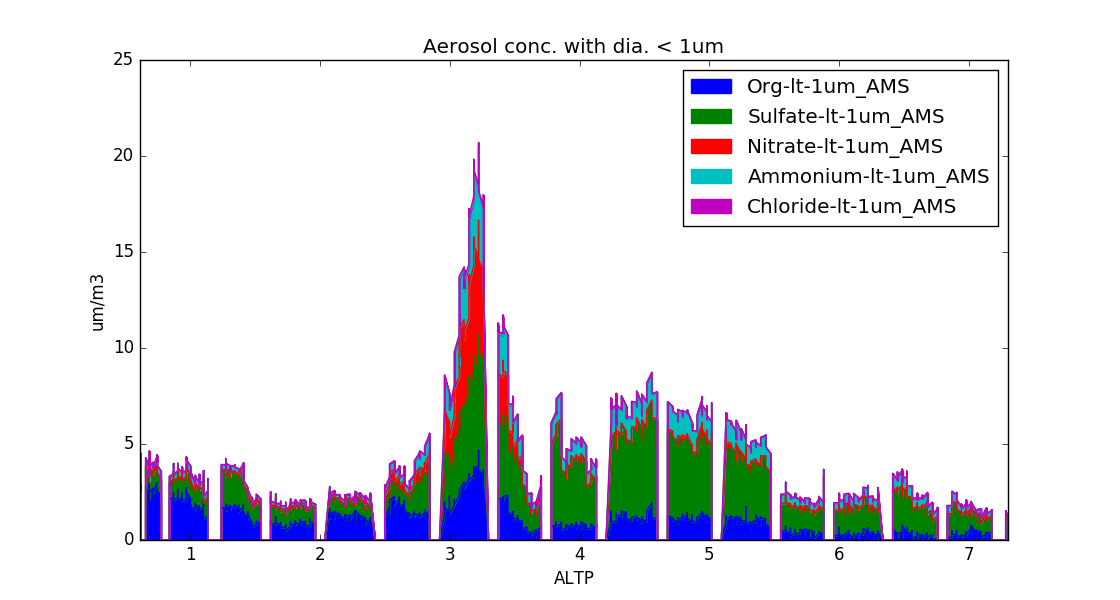
Nitrate enhancement
Nitrate is enhanced only in plume at 3km.